Prolaris Result

Interpreting your Prolaris prostate cancer test results report.

What do my Prolaris results mean?

The Prolaris® test provides an analysis of your individual tumor aggressiveness as well as a clinically validated prostate cancer-specific mortality risk.

Two patients with the same PSA and Gleason scores may have a very different estimate of mortality risk when their Prolaris Score is included in their evaluation. Since cancer is the uncontrolled rapid growth of abnormal cells, an aggressive prostate tumor carries the potential risk of growing and spreading rapidly to other parts of your body.

The Prolaris Score is calculated by directly measuring the biology of the tumor and how fast the cells in your tumor or dividing. Since you have already had a biopsy which determined that you have prostate cancer, that tissue sample can also be used to determine your Prolaris Score. And, because every individual’s prostate cancer is different, the result of your Prolaris test is unique to you.

Patient Sample Report:

Image of Prolaris Test Results.

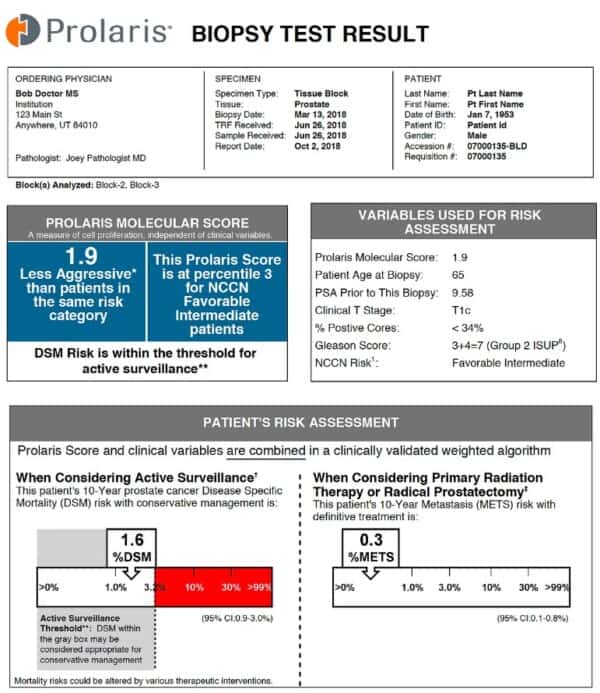
The Prolaris Molecular Score:

The Prolaris Molecular Score reveals the aggressiveness of the individual’s prostate cancer while the relative risk shows how a patient’s score compares to the average score in their National Comprehensive Cancer Network (NCCN) risk category. The majority of Prolaris Molecular Scores will fall between 0 and 10, with a higher score indicating a more aggressive cancer. For every 1 unit increase in the Prolaris Molecular Score, the patient’s risk doubles.

Clinical Variables and the Prolaris Molecular Score:

The various clinical variables listed as well as the Prolaris Molecular Score are used to calculate a patient’s risk assessment.

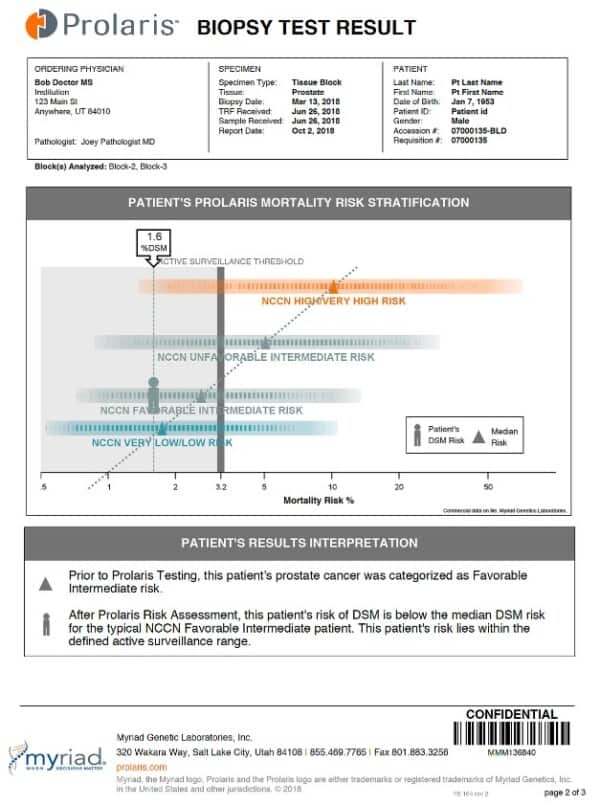
When Considering Active Surveillance:

The 10-year disease specific mortality (DSM) risk is shown either within the gray box or beyond the gray box (3). The gray box represents the Active Surveillance Threshold. Patients who have a DSM within the gray box may be considered appropriate for a more conservative management. In this example, the patient has a DSM of 1.6% and may be considered for a conservative management.

10 year risk of cancer spread after radiation or prostate removal surgery (prostatectomy):

This section describes your individual risk of dying from prostate cancer in 10 years. In this example, a 0.3% risk can be viewed as 1 man in 300 with the same genetic tumor type as shown here will have metastatic disease within 10 years.

The patient’s disease specific mortality (DSM) risk:

The patient is plotted on a chart, which is represented by the person icon. This person is compared to other patients with prostate cancer in the same NCCN risk category.  This means that your risk is stratified among other patients with similar clinical and pathological features such as PSA, Gleason Score, and age. The active surveillance threshold is shown as a gray box. This information will help you and your physician match your management plan to the personalized aggressiveness of your prostate cancer. In this example, the patient’s DSM risk is 1.6% and lies within the gray active surveillance threshold. The median DSM risk is plotted as a gray triangle. In this example, the patient lies below the median DSM risk for the typical NCCN favorable intermediate patient.